3. Interacting with visualizations: Context menus
In this section, you will learn to use the Context menu in a visualization to manipulate and analyze the data.
1. Using context menus to interact with a visualization
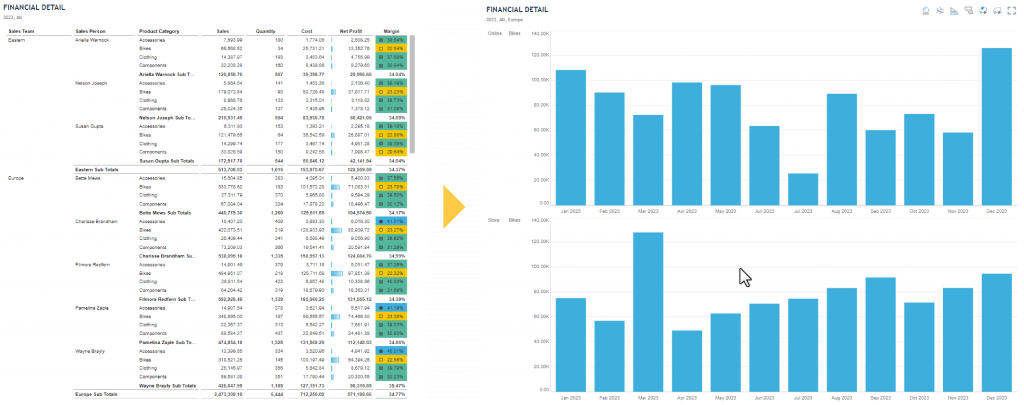
In this first activity, you will learn how to transform a Financial Detail grid into a bar chart.
